The State We're In
Help document ‘sunny day’ flooding
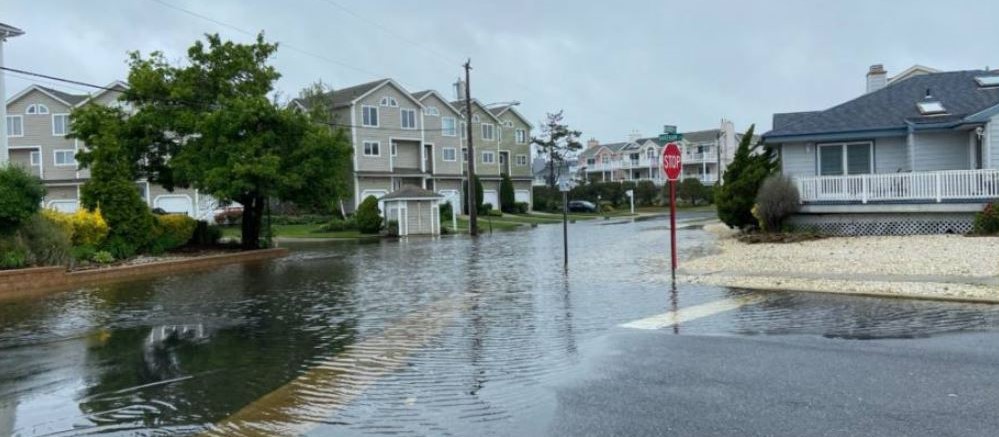
It doesn’t take a hurricane or tropical storm to flood out streets in New Jersey’s coastal towns. “Sunny day flooding,” associated with high tides rather than storms, has become common in the past two decades due to sea level rise caused by climate change. And it will get worse in the coming years.
How bad is the flooding, and where and when does it take place? That’s what the New Jersey Department of Environmental Protection and the Jacques Cousteau National Estuarine Research Reserve want to find out.
The two agencies recently launched a campaign. They are asking coastal residents to help document flooding episodes in their neighborhoods. Residents can upload photos of local flooding to a website and smartphone app called MyCoast. The portal automatically links images with data on weather conditions and tides.
The goal of MyCoast is to build a database to help government agencies, elected officials, business owners and residents understand flooding in the larger context of climate change and rising sea levels, and make informed decisions on how to avoid or reduce their impacts.
MyCoast isn’t only for folks living at the Jersey shore. All lands with tidal waters are included, like areas along the Hudson River, Passaic River, Delaware Bay and Delaware River below Trenton. According to MyCoast, 231 New Jersey municipalities in 17 counties are impacted by tides and tidal flooding.
While the MyCoast New Jersey site is still in its infancy, recent studies are deepening our awareness about how sea level rise is changing the landscape of this state we’re in.
For example, a new study led by Rutgers University found that southern New Jersey has experienced the fastest sea level rise of sites studied on the East Coast.
The study published this May in the journal Nature Communications looked at sea level rise over the past 2,000 years at six locations: Leeds Point in Atlantic County; Cape May Court House in Cape May County; Cheesequake State Park in Middlesex County; East River Marsh in Connecticut; Pelham Bay in the Bronx, N.Y.; and Roanoke Island in North Carolina.
The study found that sea levels in the six locations rose twice as fast during the 20th century than in previous centuries largely due to climate change. Impacts include melting glacier ice, warming oceans causing seawater expansion, and the sinking of land, caused in part by pumping large amounts of water from underground aquifers.
In addition, South Jersey was found to have the fastest rates of sea level rise over the 2,000-year period: 1.6 millimeters a year (0.63 inches per decade) at the Edwin B. Forsythe National Wildlife Refuge in Leeds Point, and 1.5 millimeters a year (0.6 inches per decade) at Cape May Court House.
According to an earlier Rutgers report, sea level at the Jersey shore has risen about 18 inches since the early 1900s. Researchers say it is likely that the state will experience a total sea level rise of 0.9 to 2.1 feet between 2000 and 2050, but possibly more under a worst-case scenario.
The National Oceanic and Atmospheric Administration, or NOAA for short, is also contributing data. Every year since 2015, the agency has analyzed data from 97 tide gauges along the East, West and Gulf coasts.
In the most recent report’s timeframe — May 2020 through April 2021 — the Northeastern U.S. coastline experienced an average of 6.4 days of sunny day flooding.
The national average was four days a year of flooding, a frequency that doubled in the past 20 years. New Jersey’s flooding appears to be above the average. In Sandy Hook and Atlantic City, the average number of flood days in 2000 was five; in 2020-21 it was 11. Without mitigation measures, NOAA predicts that by 2030 there will be at least 25 flood days a year in Sandy Hook and 20 in Atlantic City.
“The increased frequency of these minor flooding events is the most tangible consequence of sea level rise,” William Sweet, the report’s lead author, told journalists. Infrastructure at or below high tide elevations, he added, is “increasingly at risk.”
In addition to NOAA’s sea-level rise projections, a recent National Aeronautics and Space Administration study predicts that by the 2030s a shift in the lunar cycle will further accelerate high tide flooding.
You can help build the MyCoast database, and the ability of decision makers to respond to flooding and sea level rise. Go to https://mycoast.org/nj and start documenting flooding in your neighborhood. You can also add photos of your favorite coastal sites under the “Places We Love” category.
To read about the Rutgers study, go to www.rutgers.edu/news/sea-level-rise-20th-century-was-fastest-2000-years-along-much-east-coast. To read the NOAA report, go to https://tidesandcurrents.noaa.gov/HighTideFlooding_AnnualOutlook.html.
To learn more about the NASA study, go to https://kitzu.org/coastal-high-tide-floods-study-2030s/.
And for information about preserving New Jersey’s land and natural resources – including salt marshes and estuaries that help soak up floodwaters – visit the New Jersey Conservation Foundation website at www.njconservation.org or contact me at info@njconservation.org.
About the Authors
Alison Mitchell
Executive Director
Michele S. Byers
Executive Director, 1999-2021
John S. Watson, Jr.
Co-Executive Director, 2022-2024
Tom Gilbert
Co-Executive Director, 2022-2023
View their full bios here.
Filter
Get The Latest News
From The Garden State
In the
News